
Case Study: Auditing 420 Steam Traps at a Plant — How the SDT340 Recovered 78 Million Tenge a Year
A typical steam-system audit case using the SDT340: 420 traps, 23% faulty, a loss calculation, payback in 3 weeks, and a plan for an ongoing diagnostic program.
Article available in Russian
The full article body is currently published in Russian. A translated version is in progress — switch to Russian for the complete text.
Read in Russian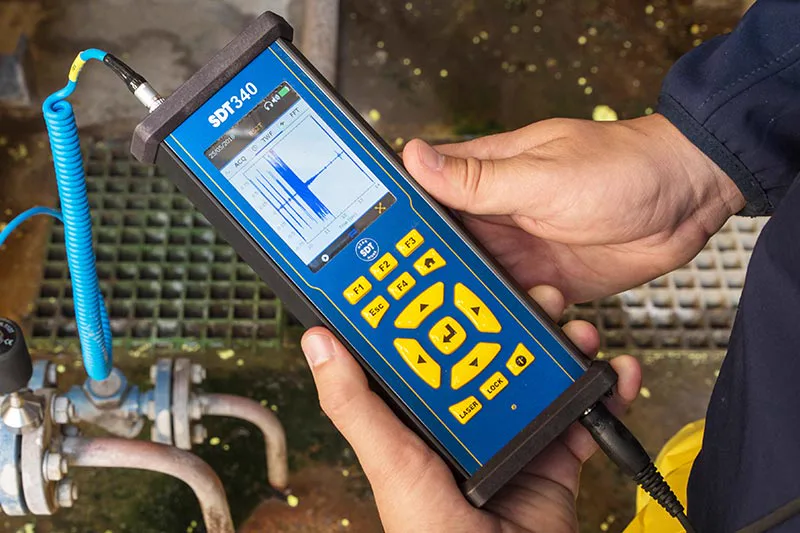
About this case. What follows is a typical calculated scenario, compiled from real-world steam-system survey practice. The figures are rounded and provided to illustrate the methodology; we'll calculate the specific numbers for your site based on your actual trap fleet.
Starting situation
A food-industry plant with its own boiler house and an extensive steam network: process lines, heat exchangers, steam tracing. The steam system comprised 420 steam traps of various types and pressures. There was no regular inspection program — traps were replaced "on failure," whenever pressure dropped at a consumer or the condensate line started knocking.
Symptoms the chief power engineer came in with:
- rising boiler fuel consumption with no increase in output;
- periodic water hammer in the condensate return lines;
- complaints about "underheating" at certain heat exchangers.
A classic picture of a steam system with no diagnostics: losses exist, but they're invisible and not tied to specific traps.
What was done: a 4-shift audit
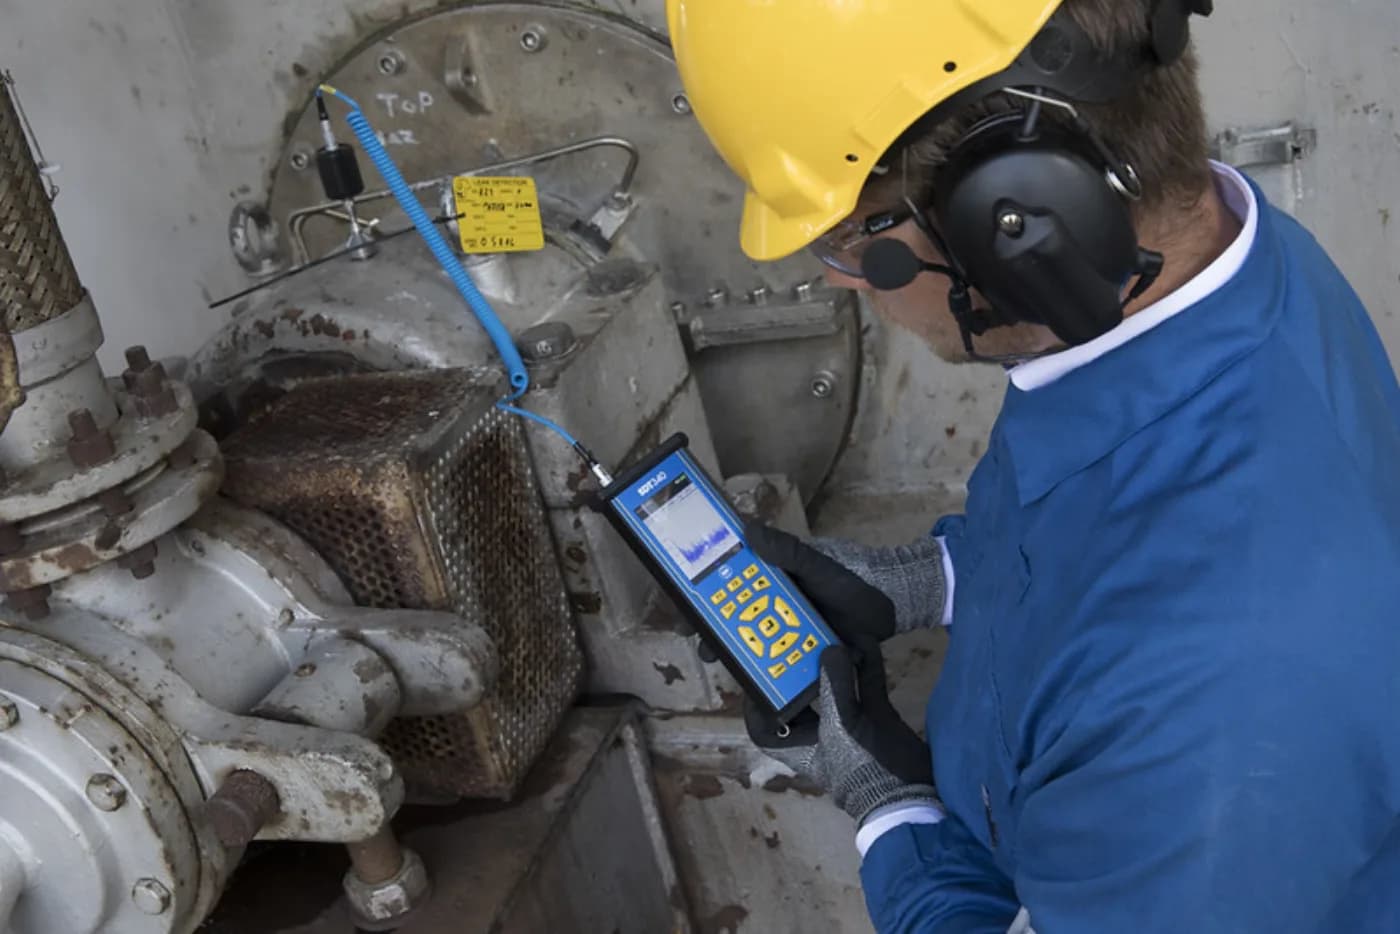
The survey was carried out with the SDT340 in TrapChecker mode. The methodology is standard (for details, see “Steam Trap Diagnostics”):
- Inventory and routes. Compiled a register of 420 traps with type, size and operating pressure, and split them into survey routes.
- Measurements. At each trap, the operator entered the type and pressure and held the contact probe for 5–10 seconds — the instrument returned its own verdict of "healthy / blow-through / failed closed" plus a loss estimate.
- Tagging and reporting. Each result was saved tagged to the trap; a report was generated with a replacement priority list.
The entire fleet was surveyed in 4 shifts by a single operations technician (not a diagnostics specialist) — the automatic verdict removed the need for specialized skill.
Survey results
| Condition | Count | Share | What it means |
|---|---|---|---|
| Healthy | 312 | 74% | Normal |
| Blow-through (failed open) | 71 | 17% | Direct steam loss |
| Failed closed | 27 | 6% | Water hammer, underheating |
| Needs re-check | 10 | 3% | Repeat measurement |
Total faulty — 98 traps (23%), which fits squarely within the industry range of 15–30% for sites with no inspection program.
Calculating the losses: doing the math
The main cost driver is the 71 blow-through traps. Steam loss depends on orifice size and pressure. A fleet-averaged estimate:
| Blow-through trap size | Count | Steam loss, kg/hr | Loss per trap, tenge/year |
|---|---|---|---|
| Small | 38 | ~9 | ~640,000 |
| Medium | 24 | ~22 | ~1,560,000 |
| Large | 9 | ~45 | ~3,190,000 |
Key assumptions behind the calculation:
- cost of steam ≈ 3,200 tenge/tonne (fuel + water treatment + boiler efficiency losses);
- steam system operating hours ≈ 8,000 hrs/year;
- lost steam equals real money going up the stack, around the clock.
Total annual losses from blow-through traps ≈ 78 million tenge. Failed-closed traps don't create direct financial losses, but they carry a risk of equipment damage and rejects — so they were also included in the repair plan.
Payback
| Item | Amount |
|---|---|
| SDT340 instrument + TrapChecker mode + software | ~7.5 million tenge |
| Operator training | ~0.5 million tenge |
| Investment (one-time) | ~8 million tenge |
| Return after repairing the blow-through traps | ~78 million tenge/year |
| Instrument payback period | ≈ 3 weeks |
Even fixing only the 9 large blow-through traps (≈ 28.7 million tenge/year) pays back the instrument from the very first survey round. The cost of replacing the traps themselves is several times lower than the returned savings and fits comfortably into the repair budget.
What happened after the audit
- Repairs by priority. First, the 9 large blow-through traps on high-pressure lines — the highest payback per unit of work — then the medium and small ones.
- Fixing the failed-closed traps. 27 stuck traps repaired to eliminate water hammer and restore heat transfer at the "underheated" exchangers.
- A regular program. The full fleet is now surveyed twice a year; critical areas quarterly. History for every trap is accumulated in SherlogReporter / UAS3.
- One instrument, many tasks. The same SDT340 was put to work in parallel on compressed-air leak detection and bearing lubrication monitoring — extra savings on top of the steam program.
Year-one impact
- ≈ 78 million tenge recovered on steam alone;
- water hammer in the condensate return lines eliminated;
- heat transfer restored at the problem exchangers;
- reduced CO₂ emissions from lower fuel burn;
- the steam system became manageable: every trap's condition and service plan is now known.
Conclusions
Auditing steam traps is one of the fastest-payback procedures at any plant with a steam system. In this case, 23% faulty traps were quietly "eating" 78 million tenge a year until ultrasound revealed them. The SDT340 with TrapChecker mode paid for itself in three weeks, and the ongoing program keeps saving money year after year. For why SDT is the right choice, see the instrument ranking and the comparison with competitors.
KEG TRK is the official SDT distributor in Kazakhstan. Submit a request — we'll audit your steam system and calculate the savings potential for your actual trap fleet.