
Lubrication Programme KPIs: 8 Metrics That Show Whether Ultrasonic Lubrication Is Working
Which indicators to track after implementing LUBExpert to prove the result to management: route completion, grease per point, skipped lubrications, lubrication-related failures, bearing MTBF. Formulas and a worked example.
In this article
Prepared by the KEG TRK team · How we prepare our content
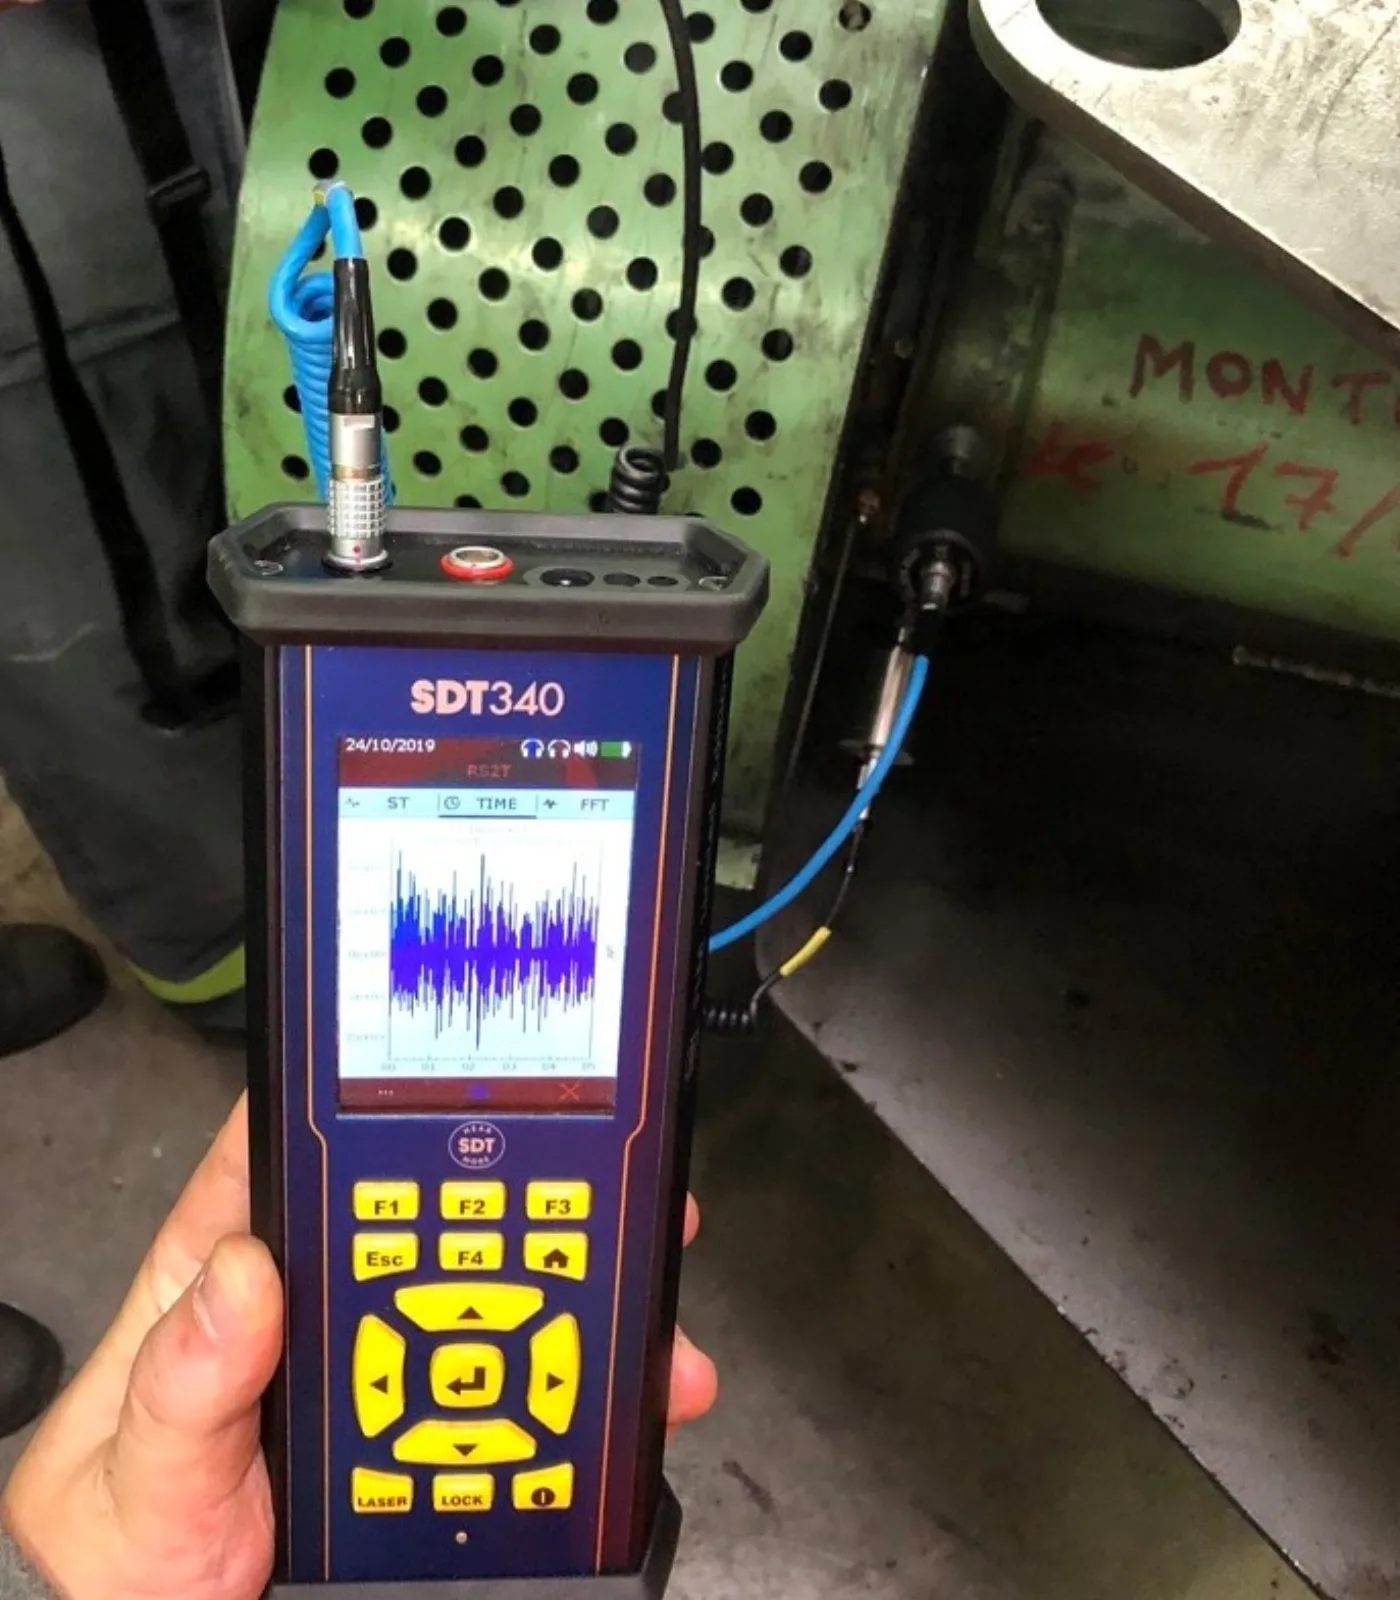
The instrument has been bought, the technicians trained, the routes loaded. Six months later the chief mechanic asks: "So what did we get out of it?" If the answer is "things got better", next year's budget is in doubt. If the answer is "grease per point dropped by a third, lubrication-related bearing failures halved, here is the trend", the conversation turns to scaling up.
Below are eight metrics worth tracking from day one with LUBExpert. Most of the data is already in UAS3; the rest is in the maintenance log.
First, capture a baseline
No metric makes sense without a "before". Before launching the programme, record for the past 12 months:
- grease purchases by brand, kg;
- bearing replacements in the pilot area, planned and unplanned;
- downtime hours related to bearing assemblies;
- labour spent on lubrication (man-hours per shift).
If exact data is missing, estimate and write down your assumptions. A rough baseline is better than none.
Execution metrics: is the programme actually running?
1. Route completion
Formula: points serviced / points planned × 100%.
The first and simplest metric. Below 90% signals overloaded routes, inaccessible points or a lack of time. Look not at the percentage but at the list of skipped points: often they are the same "awkward" assets that fail more often.
2. Share of points lubricated under ultrasonic control
Formula: points with ultrasonic readings before and after greasing / all points serviced × 100%.
Shows whether the instrument is used as intended or whether technicians grease the old way and carry LUBExpert for the report. The target is practically every point on the route except where ultrasound does not apply (asset not accessible while running, oil lubrication).
3. Share of "do not grease" decisions
Formula: points where the reading was normal and no grease was needed / all points measured × 100%.
This is the main source of savings. In the first months after leaving calendar lubrication, a noticeable share of points turns out to be fine; on a schedule they would have been greased "just in case". If this metric is close to zero, check the threshold settings and whether technicians are over-cautious. If it is very high and stays that way for years, it is time to revisit round intervals.
Equipment covered in this article
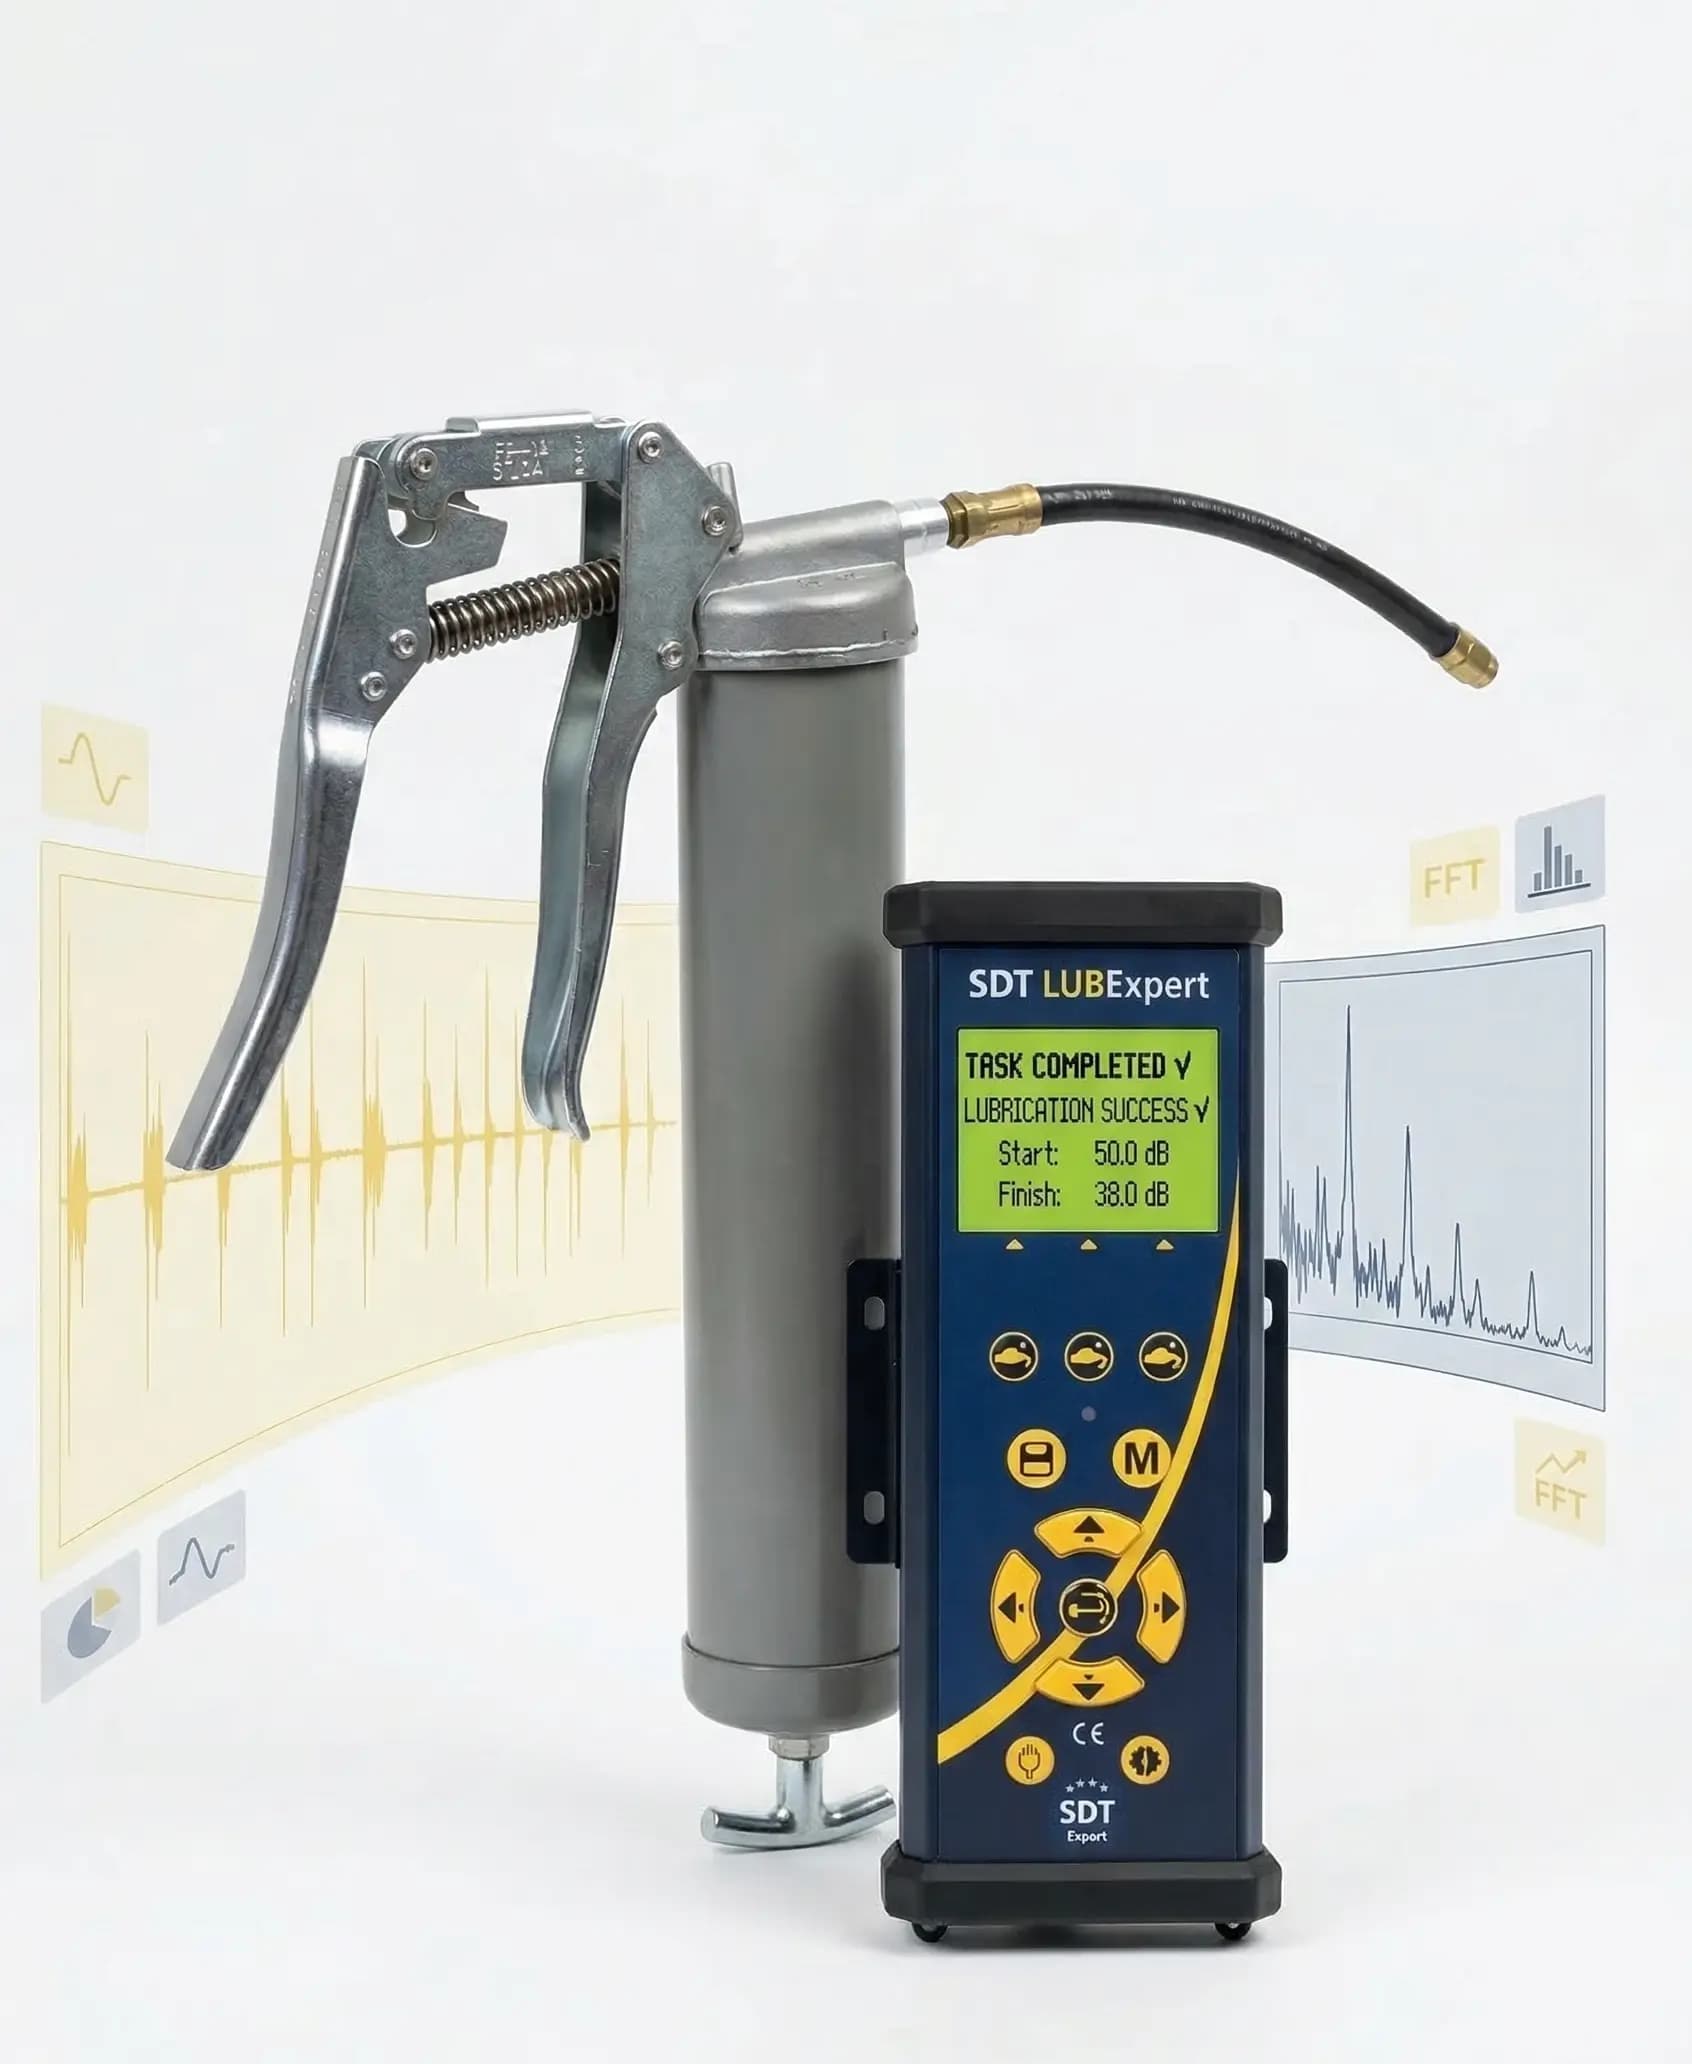
LUBExpert — SDT Ultrasound Bearing Lubrication Assistant
SDT instrument for precision ultrasound-guided greasing of rolling element bearings: tells you when to add grease and when to stop, follows routes from UAS3 and closes…
Consumption metrics: how much grease is used
4. Grease per point
Formula: grease used in the period, g / number of points serviced.
Compare by groups of similar assets (motors, conveyor pulleys, pumps), not as a plant-wide average. The calculation needs the exact output of one stroke; without grease gun calibration the metric is meaningless. Reference quantities are in the article on grease quantity.
5. Deviation of actual dose from calculated dose
Formula: (actual dose by ultrasound − calculated dose by formula) / calculated dose.
Shows how far formulas diverge from reality on your assets. A systematic excess on a group of assets is a reason to look for the cause: leaking seals, wrong grease type, contamination. A systematic shortfall means calculated doses are too high and bearings used to be over-greased.
Outcome metrics: what changed for the equipment
6. Lubrication-related bearing failures
Formula: number of failures where root cause analysis named lubrication (too little, too much, contamination, wrong type) as the cause, per period.
Requires discipline: every removed bearing is inspected and the cause recorded. Without root cause analysis this metric becomes guesswork; damage stages are covered in the article on the P-F curve.
7. Mean time between failures (MTBF) of bearing assemblies
Formula: total operating time of an asset group / number of failures in the group.
The most convincing metric for management, but the slowest: a meaningful change takes a year or more. Track it for groups of critical equipment, and rely on metrics 1–6 in the first months.
8. Defect signals passed to condition monitoring
Formula: number of points where the technician recorded an anomaly (ultrasound does not drop after greasing, rising level, unusual sound) and passed it to the condition monitoring team.
This metric measures the integration of lubrication and predictive maintenance. A bearing that does not "calm down" after greasing is a frequent early sign of damage. Every such signal confirmed by diagnostics is an unplanned stop avoided (see the bearing failure diagnosis case).
Worked example for a pilot area
A notional area: 120 grease points, a round every two weeks, data for 6 months before and after implementation.
| Metric | Before (calendar) | After (LUBExpert) |
|---|---|---|
| Route completion | ~80% (estimate) | 96% |
| Points under ultrasonic control | 0% | 92% |
| "Do not grease" decisions | 0% | 35% |
| Grease per point per round | 12 g | 7 g |
| Lubrication-related bearing failures | 6 | 2 |
| Signals to condition monitoring | 0 | 5 |
The figures are illustrative: they show the report format, not a guaranteed result. Actual values depend on the starting state of the lubrication programme; the more over-greasing there was, the bigger the savings.
How to present the report to management
- One page. A before/after metrics table, a monthly grease consumption trend, two or three concrete cases of failures avoided.
- Money, not percentages. Convert reduced grease consumption and avoided replacements into tenge. For downtime, use the cost of an hour of line stoppage; the method is in the article on the cost of unplanned downtime.
- Honest assumptions. If the baseline is estimated, say so plainly; trust in the report matters more than a nice number.
Summary
Ultrasonic lubrication pays back, but that has to be shown in numbers. Eight metrics (route completion, share under ultrasonic control, "do not grease" decisions, grease per point, deviation from calculation, lubrication-related failures, MTBF and signals to condition monitoring) give a complete picture, from technician discipline to equipment outcome.
KEG TRK helps set up reporting when implementing LUBExpert: we configure routes and reports in UAS3, capture the baseline and prepare the pilot results report.
Equipment in this article
KEG TRK quotes prices and delivery times to Kazakhstan on request. We will prepare a commercial offer for your application.
LUBExpert — SDT Ultrasound Bearing Lubrication Assistant
SDT instrument for precision ultrasound-guided greasing of rolling element bearings: tells you when to add grease and when to stop, follows routes from UAS3 and closes…

SDT340 LUBExpert — Intelligent Lubrication Control Mode
The SDT340 in LUBExpert mode combines ultrasound bearing diagnostics and lubrication management in a single field instrument.
Read also
9/30/2026
Training Lubrication Technicians in Ultrasound: Competencies, ISO 18436 Certification and the Role of LUBExpert
What a lubrication technician working with an ultrasonic instrument should know and be able to do: a competency matrix, training levels, personnel certification under ISO 18436 and ICML, and an on-site training programme.
9/28/2026
7 Mistakes When Implementing Ultrasonic Bearing Lubrication and How to Avoid Them
Why a purchased LUBExpert sometimes ends up in a cupboard: lubrication without a point map, uncalibrated grease guns, greasing stopped equipment, ignored defect signals. A breakdown of typical mistakes and what to do about them.
7/25/2026
Automatic vs manual bearing lubrication: which to choose
A comparison of manual route lubrication, time-based lubricators and condition-based automatic lubrication. When a grease gun is enough and when you need ON-GUARD.