
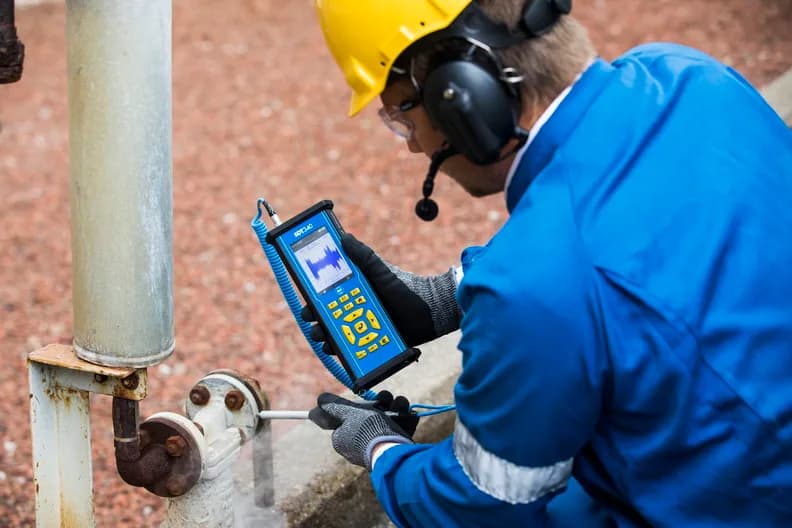
What Is Predictive Maintenance of Equipment (PdM)
Predictive maintenance (PdM) means repairing a machine based on its measured condition (vibration, ultrasound, thermography, oil and current analysis), not the calendar, before it fails.
Predictive maintenance (PdM) is a strategy in which repairs are scheduled according to the actual condition of a machine rather than the calendar. Condition is measured with vibration analysis, ultrasound, thermography, oil analysis and motor current analysis. The aim is to spot the onset of degradation and remove its cause before the component fails, and to plan the work without an unplanned shutdown.
Definition
The U.S. Department of Energy (DOE) Operations & Maintenance Best Practices Guide defines predictive maintenance as measurements that detect the onset of system degradation, allowing causal stressors to be eliminated or controlled before any significant deterioration in the component's physical state. The key difference from preventive maintenance is that the need for maintenance is based on the actual condition of the machine rather than a preset schedule.
The general procedures for setting up a machine condition monitoring programme are described in the international standard ISO 17359:2018 "Condition monitoring and diagnostics of machines — General guidelines". It applies to all machines and refers to the standards for individual techniques.
Four maintenance strategies compared
| Strategy | When work is done | Advantages | Disadvantages |
|---|---|---|---|
| Reactive (run to failure) | After a breakdown | No maintenance cost while the machine runs | Unplanned downtime, overtime, secondary damage, large spare parts inventory |
| Planned preventive | On a calendar or run-hours schedule | Fewer failures, life closer to design; per DOE, 12–18% savings over reactive | Catastrophic failures still possible; some work is unneeded, and unnecessary disassembly can damage components |
| Condition-based | When a measured parameter exceeds an alarm limit | Work only where it is needed | Requires instruments, trained staff and justified alarm limits |
| Predictive (PdM) | Based on the condition trend, planned before failure | Per DOE, 8–12% savings over preventive; less downtime and lower parts costs | Investment in diagnostic equipment and training; savings not readily seen by management |
In practice condition-based and predictive maintenance are closely related: both rely on measurements. The difference is one of emphasis. The first acts when an alarm limit is exceeded; the second follows the trend and plans work in advance while the fault is still developing. The DOE guide treats them together as maintenance based on actual condition.
Equipment covered in this article
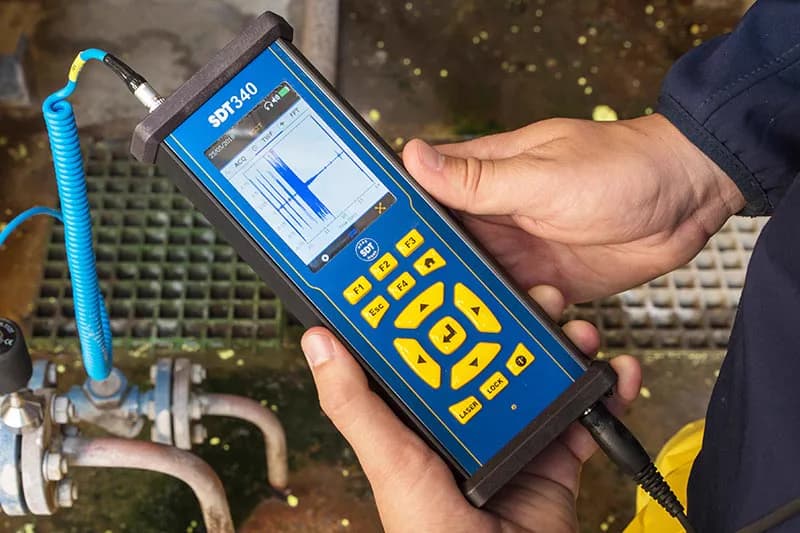
SDT340 - Advanced Ultrasound Detector
The most advanced ultrasound detector for collecting, analysing and trending data
What the DOE figures say
The DOE guide (Release 3.0, 2010) gives the following estimates:
| Indicator | Value |
|---|---|
| Preventive savings over a reactive programme | 12–18% |
| Predictive savings over a preventive-only programme | 8–12% |
| Return on investment in a predictive programme (industrial average survey data) | 10 times |
| Reduction in maintenance costs | 25–30% |
| Elimination of breakdowns | 70–75% |
| Reduction in downtime | 35–45% |
| Increase in production | 20–25% |
The same guide describes the maintenance mix: at an average facility over 55% of work is reactive, 31% preventive and 12% predictive. At consistently top-performing facilities, reactive work is under 10%, preventive 25–35% and predictive 45–55%. These are U.S. figures; the result at a particular plant depends on the starting condition of the equipment and the share of emergency repairs.
The P-F curve: why catch faults early
The P-F curve shows how a component's condition deteriorates over time:
- point P (potential failure) — when a developing fault can first be detected;
- point F (functional failure) — the component can no longer perform its function;
- P-F interval — the time between them, the window for planning the repair.
Methods applied to a running machine that detect a fault earlier move point P to the left and widen the window. Closer to failure, the fault becomes evident through heat and noise. How this looks for a rolling bearing is covered in 4 stages of bearing failure.
Which technologies are used
| Technology | What it detects | Where it is used |
|---|---|---|
| Vibration analysis | Unbalance, misalignment, mechanical looseness, rubs, resonance, bearing and gear defects | Pumps, electric motors, fans, gearboxes, turbine sets |
| Ultrasound (airborne and contact) | Early bearing defects and lack of lubrication, gas and vacuum leaks, failed steam traps, arcing and corona in electrical equipment | Bearings, compressed air and steam systems, valves, switchgear |
| Infrared thermography | Overheated contacts, bearings and belts, damaged insulation and refractory | Electrical panels, transformers, motors, boilers, heat exchangers |
| Oil and wear particle analysis | Oil degradation and contamination, water, wear debris | Gearboxes, hydraulic systems, engines, transformers |
| Motor current and electrical analysis (MCSA) | Turn-to-turn and phase-to-phase shorts, insulation deterioration, and some mechanical faults: misalignment, unbalance, gear wear | Electric motors and the machines they drive |
According to NASA research cited by DOE, a 12–50x increase in the amplitude of a monitored ultrasonic frequency (28–32 kHz) can give an early indication of bearing deterioration. For electric motors, DOE notes that infrared and vibration do not provide all the answers on motor condition, so current analysis is added. More on the vibration method is in What is equipment vibration analysis.
How to start: a step-by-step plan
- List your equipment and rank it by criticality. Consider the consequences of failure for production and safety and the cost of downtime. The DOE guide, citing NASA, offers a simple rule: small and non-critical items can stay on reactive maintenance, wear-prone and consumable items on preventive, and critical equipment and items with random failure patterns on predictive.
- For each critical machine, identify the main failure modes and choose a method that detects them (table above). For a motor-driven pump this is usually vibration and ultrasound on the bearings plus motor current analysis.
- Build a measurement route. Number the measurement points, fix their positions (markers or permanent mounting pads) and set the frequency. The interval between measurements must be clearly shorter than the P-F interval, otherwise a fault will slip through.
- Take baseline readings. The first measurements on a healthy machine become the reference for the trend. To get started, DOE accepts generic vibration severity charts but stresses that these are not absolute limits: alarm limits are then refined from your own equipment's history.
- Watch the trend and plan the work. A rise relative to the baseline is a reason for in-depth diagnostics and a planned repair at the next shutdown.
- Train staff and assign responsibility. DOE stresses that equipment for an in-house programme should not be purchased without a serious commitment to implementation, operator training and instrument upkeep.
Other strategies that help reduce downtime are covered in 10 maintenance strategies that reduce downtime.
Which equipment to choose
- Ultrasound for bearings, lubrication, leaks and electrical equipment — SDT340.
- Portable vibration analyzer for route measurements — vb8.
- Online monitoring of electric motors and drives from current and voltage — Artesis e-MCM.
- On-site oil analysis — field oil analysis lab.
KEG TRK supplies predictive maintenance equipment in Kazakhstan. Price on request.
Sources
- U.S. Department of Energy, FEMP / PNNL. Operations & Maintenance Best Practices — A Guide to Achieving Operational Efficiency, Release 3.0 (PNNL-19634), 2010, chapters 5 and 6.
- ISO. ISO 17359:2018 Condition monitoring and diagnostics of machines — General guidelines.
- Fluke. P-F curve: stay ahead of equipment failure.
Frequently asked questions
Equipment in this article
KEG TRK quotes prices and delivery times to Kazakhstan on request. We will prepare a commercial offer for your application.
SDT340 - Advanced Ultrasound Detector
The most advanced ultrasound detector for collecting, analysing and trending data

vb8 — portable vibration analyzer
Advanced on-site analysis and diagnostics
Also in this article: Artesis e-MCM — Online Sensorless Motor Monitoring, Field oil analysis laboratory
Read also
10/14/2026
How to Check an Electric Motor: Step-by-Step Checklist
A motor is checked in two stages: locked out (visual check, megger insulation test, winding resistance), then running (phase currents, temperature, vibration, bearing ultrasound, current signature).
10/10/2026
What Is Machinery Vibration Analysis and How to Start
Vibration analysis checks machine condition from bearing housing vibration: what is measured, route-based vs online monitoring, which faults show in the spectrum, how to start.
10/10/2026
Electric Motor Diagnostics: Which Method Shows What
Vibration, ultrasound, thermography, current analysis (MCSA/ESA), motor circuit analysis (MCA), megohmmeter and oil analysis: which faults each method sees, where it stops and how to combine them.