
What Is Machinery Vibration Analysis and How to Start
Vibration analysis checks machine condition from bearing housing vibration: what is measured, route-based vs online monitoring, which faults show in the spectrum, how to start.
Machinery vibration analysis is condition monitoring of rotating machines based on the vibration of their bearing housings. A sensor measures the overall vibration level, which is compared with the ISO 10816-3 limits and with the machine's own baseline; when the level rises, the spectrum shows the cause: unbalance, misalignment, looseness or a bearing defect.
This article is the entry point to our vibration analysis section. Each part links to a more detailed article.
What is measured
Vibration is described by three quantities. They are linked through frequency, but they behave differently across the frequency range: at the same velocity, acceleration amplitude rises with frequency and displacement amplitude falls. Velocity depends least on machine running speed, which is why it is the usual choice for overall assessment.
| Quantity | Units | Where it is useful |
|---|---|---|
| Velocity | mm/s, RMS | Overall machine condition. ISO 10816-3 uses RMS in the 10–1000 Hz band |
| Acceleration | g, m/s² | High frequencies: bearing impacts, gear mesh |
| Displacement | µm | Low frequencies and slow machines; shaft motion relative to the housing |
There are two types of sensors. Accelerometers and velocity sensors are mounted on the bearing housing and measure absolute housing vibration. Non-contact proximity probes measure shaft displacement relative to the bearing housing. This matters because there is a finite clearance between the rotor and the bearings, seals and casing, and housing vibration is not the same as shaft motion.
Velocity limit tables for motors, pumps and fans above 15 kW are in the article "Electric motor vibration limits per ISO 10816-3".
Overall level, spectrum and time waveform
Vibration analysis works at three levels of detail:
- Overall level (one number, such as 3.2 mm/s) answers "is there a problem". It is compared with the standard's zones and with the trend.
- Spectrum is calculated from the signal with the Fast Fourier Transform (FFT). It shows at which frequencies the vibration is concentrated and answers "what exactly is wrong". The reference frequency is shaft running speed (1x).
- Time waveform and envelope. A non-sinusoidal waveform points to looseness. Envelope analysis isolates modulation and helps find early bearing and gear defects that are hard to see in a normal spectrum.
A step-by-step guide to reading spectra is in "How to read an FFT spectrum".
Equipment covered in this article

SCOUT220-IS — intrinsically safe collector
ATEX Zone 0/1, Bluetooth, built-in accelerometers
Which faults vibration analysis detects
| Fault | Sign in the spectrum or waveform | More |
|---|---|---|
| Unbalance | Dominant peak at running speed, 1x | Field balancing |
| Shaft misalignment | 1x and 2x peaks, often elevated axial vibration | Shaft misalignment |
| Mechanical looseness | Non-sinusoidal waveform, 3x, 4x, 5x harmonics | |
| Rolling bearing defects | High-frequency content at BPFO, BPFI, BSF, FTF | Bearing failure stages |
| Gear defects | Sidebands around gear mesh frequency | Gearbox diagnostics |
| Resonance | Amplified vibration at a natural frequency of a component or structure | |
| Broken rotor bars in induction motors | Sidebands at pole pass frequency | Causes of motor vibration |
1x and 2x peaks alone are not enough for a diagnosis: unbalance, misalignment and rubs can all produce them. Conclusions are drawn from several signs together: measurement direction (radial or axial), phase, waveform shape and trend.
Route-based and online monitoring
| Route-based (periodic) monitoring | Online monitoring | |
|---|---|---|
| How it works | An engineer walks a set route with a portable data collector | Wired or wireless sensors stay on the machine |
| Data frequency | Per the route schedule | Automatic, no one on site needed |
| Which machines | Where periodic checks are enough | Critical, remote, hard-to-reach, high-speed |
| What it takes | Trained staff and route planning | Sensor installation and a link to the platform |
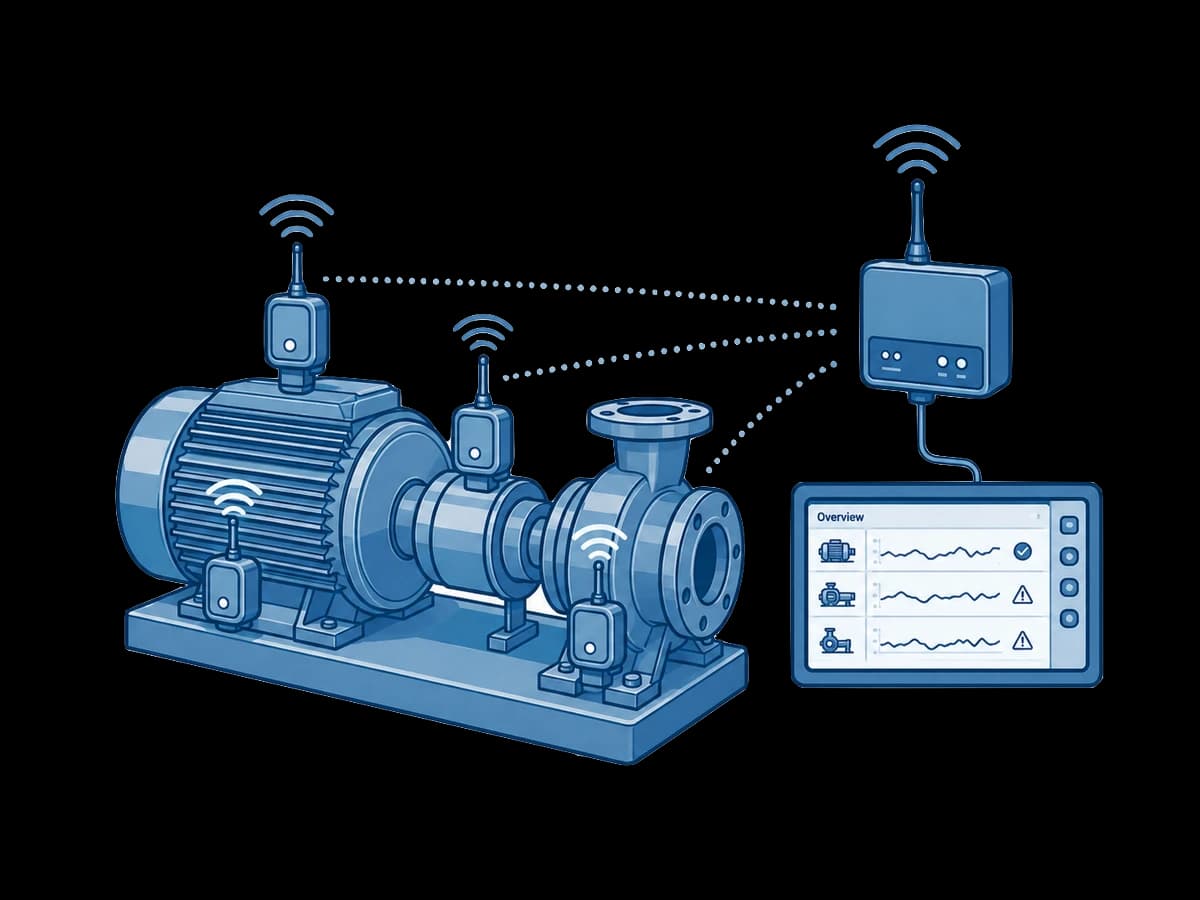
In practice both are combined. Routes cover most auxiliary machines. Online sensors go where a stop is expensive or where access is difficult or unsafe. Wireless sensors remove the need for cabling: see "Wi-care wireless vibration monitoring".
How to start: first steps of a programme
- Machine list and criticality. List pumps, fans, motors, gearboxes and compressors. Mark the ones whose stop halts production.
- Monitoring method. For each machine choose a route or an online sensor.
- Measurement points. On the bearing housings in two radial directions; axial during periodic rounds. Mark the points so that each reading is taken at the same spot.
- Baseline. The first reading in normal operation: rated speed, load, bearings at operating temperature. Later readings are compared at the same speed, load and temperature.
- Alarm levels. For the overall level use the ISO 10816-3 zones and the rule that a change of 25% of the zone B upper limit is significant (see the vibration limits article).
- Analysis and action. When vibration rises, take a spectrum, find the cause and plan the repair: balancing, alignment, tightening, bearing replacement or lubrication.
- Training. In-depth spectrum analysis needs a trained analyst. According to I-care, it usually requires ISO 18436 Category II or III certification.
Which instrument to start with
- A portable data collector and analyser for routes: the Bently Nevada SCOUT220-IS, with 2 simultaneous channels, up to 12,800 lines of spectral resolution, Fmax up to 80 kHz and intrinsically safe ratings. Routes are prepared and data analysed in System 1 software. How a simple meter differs from an analyser: "Vibration meter or vibration analyser".
- Online monitoring without cables: the I-care Wi-care 130 G23 wireless triaxial sensor.
KEG TRK supplies Bently Nevada, I-care and SDT equipment in Kazakhstan and helps set up vibration monitoring programmes. Price on request.
Sources
- I-care. What is Vibration Analysis in Predictive Maintenance? — https://www.icareweb.com/knowledge/predictive-maintenance/what-is-vibration-analysis-predictive-maintenance/
- Bently Nevada (Baker Hughes), Orbit. Accelerometers: What do I use? — https://www.bakerhughes.com/bently-nevada/orbit-home/orbit-article/accelerometers-what-do-i-use
- Bently Nevada. SCOUT220-IS and SCOUT240-IS Portable Data Collectors Datasheet 109M0226 — https://dam.bakerhughes.com/m/54b98a9e1e80eaf6/original/SCOUT220-IS-and-SCOUT240-IS-Portable-Data-Collectors-Datasheet-109M0226-pdf.pdf
- ISO 10816-3:1998 — via the article "Electric motor vibration limits".
Frequently asked questions
Equipment in this article
KEG TRK quotes prices and delivery times to Kazakhstan on request. We will prepare a commercial offer for your application.
SCOUT220-IS — intrinsically safe collector
ATEX Zone 0/1, Bluetooth, built-in accelerometers
vb7 — collector, analyzer and balancer
Dual channel simultaneous recording, two-plane balancing, IP65
Also in this article: SDT340 - Advanced Ultrasound Detector, I-care Wi-care 130 G23 — wireless vibration sensor, Ranger Pro — wireless vibration monitoring
Read also
10/10/2026
Vibration Meter or Vibration Analyser: Which to Choose
A vibration meter shows the overall level and tells you if there is a problem. An analyser adds the spectrum and waveform and shows the cause. A comparison by task, function and example instruments.
10/10/2026
Causes of Electric Motor Vibration and How to Tell Them Apart
Unbalance, misalignment, looseness, bearings, resonance, rotor and stator faults, driven machine problems. Which spectrum and waveform signs separate one cause from another.
10/10/2026
Electric Motor Diagnostics: Which Method Shows What
Vibration, ultrasound, thermography, current analysis (MCSA/ESA), motor circuit analysis (MCA), megohmmeter and oil analysis: which faults each method sees, where it stops and how to combine them.